S&P/TSX Dividend Aristocrats Index
Overview
Dividend investing is popular, but is the strategy worth pursuing or are investors just better off going with an Index ETF which more broadly tracks the market? After analyzing the S&P/TSX High Dividend Index, I concluded that this particular Index was not worth pursuing largely because of its reliance on market capitalization to set the weights. In short, it didn’t appear to be a true high dividend index because even if a stock has a high dividend yield, its weight in the index could be minimal due to its low market capitalization. The opposite is true as well - stocks which have unimpressive dividend yields may be given a high weight due to their high market capitalization. Investors may easily be fooled by the name alone.
The S&P/TSX Canadian Dividend Aristocrats appears to solve the market capitalization problem though. Instead, the index is weighted by a company’s indicated annual dividend yield. In addition, here are some other key points for how the Index is constructed:
Companies must have increased ordinary cash dividends every year for five years, but can maintain the same dividend for two consecutive years within that period
The 10-day float adjusted market capitalization must be at least $300 million
There is a minimum of 40 securities in the Index. If there are not 40 securities meeting the above criteria, then the highest yielding securities with four years of dividend growth patterns are considered.
No security can have a weight of more than 8% of the Index.
From the table below, you can see that the Index is made up of companies in sectors that usually have a pretty reliable stream of cash.

Historical Performance
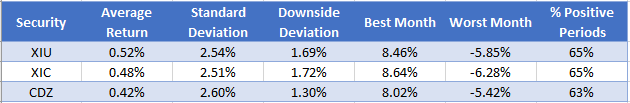
I will be comparing the S&P/TSX High Dividend Index with iShares’ Large Cap Index ETF (XIU) and iShares’ Composite Index ETF (XIC). The corresponding ETF for the Dividend Aristocrats Index is CDZ. I always prefer to look at ten years of returns in my analysis, however since the market has not experienced a substantial recession in that time, I will lengthen my time period to include data from 2008. Below are the results, assuming dividends are reinvested:

The above are monthly metrics. To convert monthly standard deviation to annual standard deviation, multiply by the square root of 12, e.g. 3.62% x 3.464 = 12.54%
We are pleasantly surprised to see that the Dividend Aristocrats Index ETF (CDZ) beats its comparators in all aspects, including a higher average return, lower risk (both total and downside), and has better best/worst month metrics as well. Investors may be dissuaded by this ETF due to its higher Management Expense Ratio (MER) of 0.66% vs. 0.18% for XIU and 0.06% for XIC, however they shouldn't be as the metrics above are based on returns net of fees.
As I mentioned above, I take a long-term view of the market when creating an equity portfolio, however this isn’t for everyone. My analysis above may not be applicable to you either if you believe the stock market is going to continue being strong for years to come. From the table below, you can see how these metrics change if I use the last 60 months (5 years) of returns instead:
Although the downside risk is substantially lower than its two competitors, the average return is as well. Your choice among these ETF’s is therefore dictated by what you think is going to happen in the next 5-10 years.
Summary
Based on the data above, I would argue you are better off investing in the Dividend Aristocrats Index ETF (CDZ) if you believe a recession is coming, and the Large Cap Index ETF (XIU) if you believe the economy will continue its growth. Your decision should be based on how long you plan to hold the ETF and how it fits into your overall investment strategy.
It appears as though investing based on dividend yields does have some merit, and it makes sense: companies which have a history of increasing their dividends likely have increasing cash flow to sustain those dividend payments. The methodology of the index is sound: it kicks companies out if they simply maintain their dividend for more than 2 years, and companies with the highest yields get the highest weights. This distinction is key, as the S&P/TSX High Dividend Index screens for high dividend yielding companies, but still weights them based on market capitalization anyways. While the two Indexes have attractive names, they are vastly different!
Thanks for reading and if you haven’t done so already, please subscribe for free to receive instant access to dividend, income, growth, and contrarian investment reports, weekly stock performance reports, and more!